
If you’d rather skip the math, you can run any of these numbers instantly in our free ROAS calculator — it also handles break-even ROAS, CPM, CPC, CPA and ACoS. But understanding why the numbers matter is what separates advertisers who scale profitably from those who quietly burn budget.
ROAS stands for Return On Ad Spend. It measures how much revenue you generate for every dollar you put into a paid advertising campaign. It’s the single fastest gauge of whether a campaign is pulling its weight, which is why almost every marketer on Google Ads, Meta, TikTok and Amazon lives and dies by it.
ROAS is usually written two ways that mean the same thing:
- As a multiple — “a 4x ROAS” (four dollars back per dollar spent)
- As a percentage — “a 400% ROAS” (the same figure × 100)
Both are correct. Google Ads reports ROAS as a percentage (400%), while most agencies and advertisers say it as a multiple (4x) in conversation. Whichever you use, higher is better — but how much higher you need is where most people get it wrong.
The ROAS formula is simple:
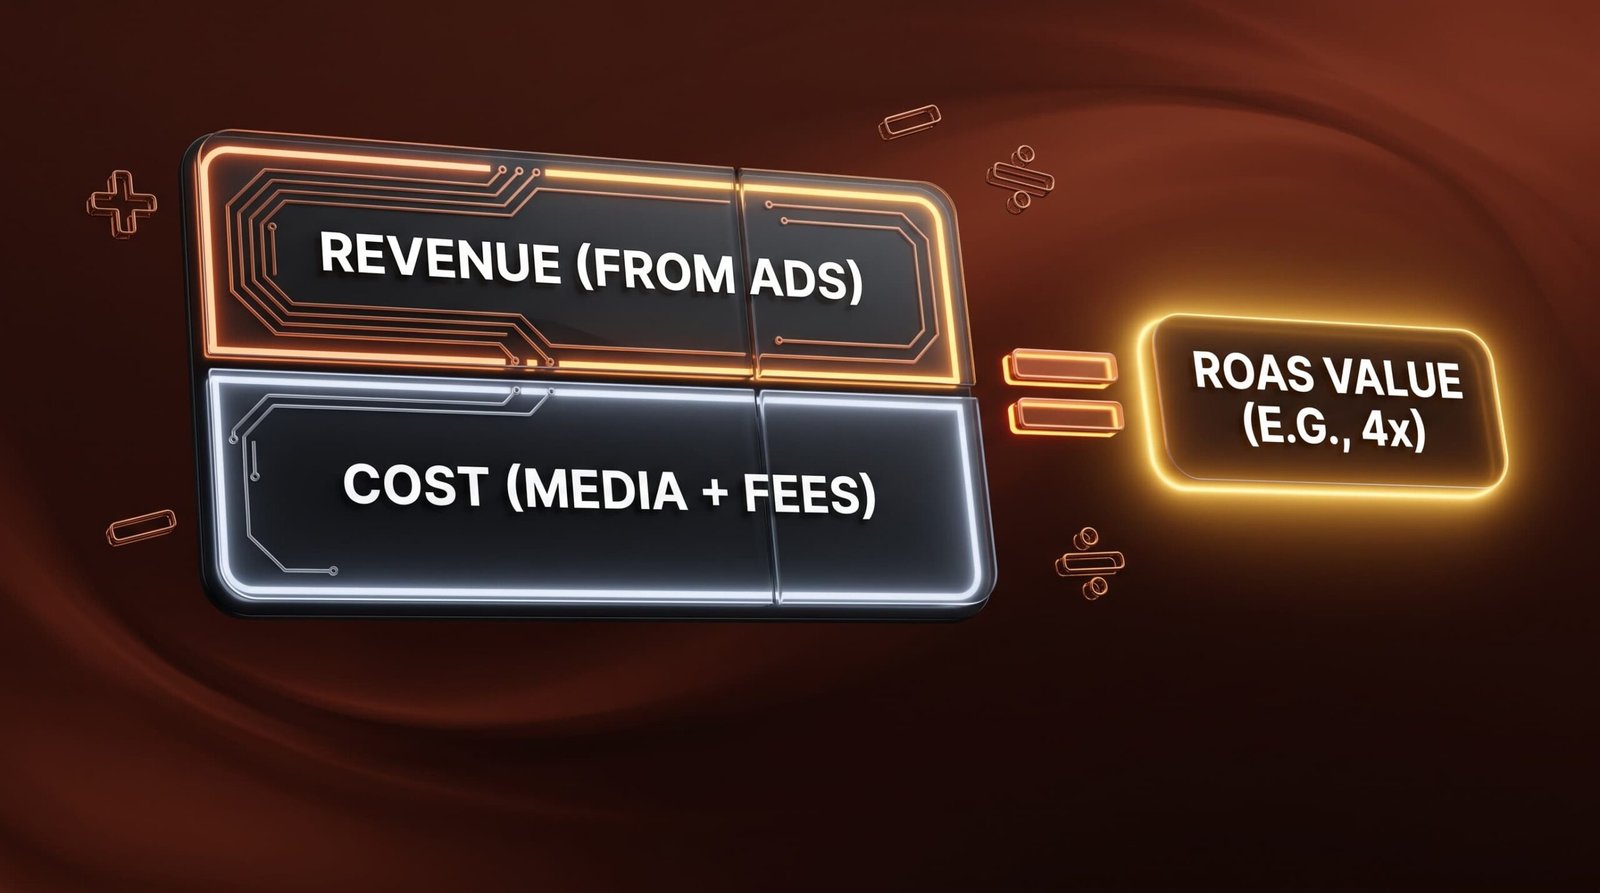
ROAS = Revenue from ads ÷ Ad spend
To express it as a percentage, multiply the result by 100:
ROAS % = (Revenue from ads ÷ Ad spend) × 100
That’s the entire calculation. The difficulty isn’t the arithmetic — it’s making sure the two numbers you plug in are honest. “Revenue from ads” should be the revenue attributable to the campaign, and “ad spend” should include the full cost of running it. Get either one wrong and your ROAS becomes a vanity number.

How to calculate ROAS, step by step
Here’s how to work it out for any campaign:
- Pick your time period. A week, a month, or the campaign’s full run — just make sure both numbers cover the same window.
- Add up total ad spend. Everything the platform charged you for that campaign in that period.
- Add up the revenue that campaign generated. Use your ad platform’s conversion value, your analytics, or your store’s order data.
- Divide revenue by spend. That’s your ROAS as a multiple.
- (Optional) Multiply by 100 to express it as a percentage.
Worked example 1 — e-commerce
You spent $3,000 on Meta ads last month and those ads drove $12,000 in sales.
- ROAS = $12,000 ÷ $3,000 = 4.0x (or 400%)
- You earned $4 for every $1 spent.
Worked example 2 — thin margins
You spent $5,000 on Google Ads and generated $15,000 in revenue.
- ROAS = $15,000 ÷ $5,000 = 3.0x (or 300%)
A 3x ROAS looks healthy. But if your profit margin is only 25%, you’re actually losing money — and that’s the trap the next section exists to prevent.
Publish a connected set of posts around one theme rather than scattered one-offs. A tight cluster signals genuine expertise. Our own AI cluster — webMCP, AI agents vs chatbots, and answer engine optimization — is built exactly this way.
The metric everyone forgets: break-even ROAS
Here’s the uncomfortable truth: ROAS alone cannot tell you if you’re profitable. A 4x ROAS is a disaster for a business with 15% margins and a goldmine for a business with 70% margins. To know whether a campaign actually makes money, you have to compare your ROAS to your break-even ROAS.
Break-even ROAS = 1 ÷ Profit margin
Your break-even ROAS is the minimum return you need just to cover your costs. Anything above it is profit; anything below it means you’re paying to acquire customers at a loss.
| Profit margin | Break-even ROAS | Healthy target |
|---|---|---|
| 20% | 5.0x | 6x+ |
| 30% | 3.3x | 4x+ |
| 40% | 2.5x | 3x+ |
| 50% | 2.0x | 2.5x+ |
| 60% | 1.7x | 2x+ |
| 70% | 1.4x | 1.8x+ |
Look back at worked example 2. A 3x ROAS with a 25% margin means a break-even ROAS of 1 ÷ 0.25 = 4x. You needed 4x just to break even, and you only hit 3x — so every sale lost money, even though the dashboard looked green. This is the single most common, most expensive mistake in paid advertising.
Our free ROAS calculator does this comparison for you automatically: enter your margin and it tells you, in plain language, whether you’re above or below break-even.
What is a good ROAS?
A good ROAS is any figure comfortably above your break-even ROAS. For many e-commerce brands with 40–60% margins, that lands around 3x–4x. But there’s no universal “good” number, because it’s entirely relative to your margins and your business model.
Some rough, directional benchmarks for 2026:
- 2x–3x — common for high-margin businesses (software, digital products, high-margin DTC)
- 3x–4x — a typical profitability target for mid-margin e-commerce
- 4x–6x+ — what thin-margin retail and dropshipping often need to actually profit
- Below break-even — a signal to fix targeting, creative, landing pages or tracking before scaling
Is 20x a good ROAS? Yes — a 20x ROAS (2,000%) is exceptional and far above break-even for any margin. It usually means one of two things: you’ve found a highly efficient campaign worth scaling, or your attribution is over-crediting ads for sales that would have happened anyway. Either way, it’s worth investigating rather than celebrating blindly.
What does a 1.5 ROAS mean? It means you earn $1.50 for every $1 spent (150%). Unless your margins are very high (above ~67%), a 1.5x ROAS is below break-even and the campaign is losing money.
ROAS vs ROI: what's the difference?
People use ROAS and ROI interchangeably, but they measure different things:
- ROAS compares revenue to ad spend only. It’s fast, campaign-level, and perfect for day-to-day optimization.
- ROI (return on investment) compares profit to your total investment — ad spend plus product costs, tools, salaries, shipping and everything else.
ROAS answers “is this campaign efficient?” ROI answers “is this business making money?” You want to optimize campaigns with ROAS daily, then sanity-check the whole operation with ROI monthly. A campaign can have a strong ROAS and still drag down ROI if your overheads are high — which is exactly why break-even ROAS (which bakes in your margin) is the bridge between the two.

ROAS vs ACoS: the Amazon translation
If you advertise on Amazon, you’ll see ACoS (Advertising Cost of Sale) instead of ROAS. They’re two sides of the same coin — inverses of each other:
ROAS = 100 ÷ ACoS and ACoS = 100 ÷ ROAS
- 25% ACoS = 4x ROAS
- 50% ACoS = 2x ROAS
- 10% ACoS = 10x ROAS
With ACoS, lower is better (you’re spending a smaller share of sales on ads). With ROAS, higher is better. Your Amazon break-even point is when your ACoS equals your profit margin — a 40% margin means you break even at 40% ACoS. You can convert between the two instantly in the ACoS ⇄ ROAS tab of our ROAS calculator, which is handy if you run ads across Amazon and Google/Meta and need everything in one language.
ROAS for dropshipping and e-commerce
Dropshipping and low-margin e-commerce are where ROAS mistakes get expensive fastest. Because dropshipping margins are often just 15–30% before ad spend, a “good-looking” 3x ROAS frequently isn’t good enough:
- A 20% margin needs a 5x break-even ROAS — so a 3x ROAS loses money on every order.
- A 30% margin needs a 3.3x break-even ROAS — a 3x ROAS is still slightly underwater.
The lesson for dropshippers: never judge a campaign by ROAS alone. Calculate your true margin (product cost + shipping + fees + returns), find your break-even ROAS, and only scale campaigns that clear it with room to spare. Testing new products at a small budget and killing anything below break-even quickly is how profitable dropshipping operations protect their cash.
Blended ROAS vs platform ROAS (why your numbers don't match)
Ever noticed your Meta Ads Manager reports a 4x ROAS but your bank account tells a different story? That’s the gap between platform ROAS and blended ROAS.
- Platform ROAS is what Google, Meta or TikTok report using their own attribution. Every platform takes generous credit for conversions — including view-through conversions and sales that might have happened anyway — so platform ROAS is almost always inflated.
- Blended ROAS is your total revenue ÷ total ad spend across all channels. It’s the honest, bottom-line number because it can’t double-count.
If your platform ROAS looks great but revenue isn’t growing, trust the blended number. A big gap between the two usually points to attribution overlap or broken conversion tracking — which brings us to the fixes.
How to set your target ROAS
Your target ROAS is the return you aim for on a campaign — and it should always sit above your break-even ROAS, never at it. The gap between the two is your profit margin on ad spend, plus a buffer for the costs ROAS ignores (returns, overheads, the odd bad week).
A simple way to set it:
- Find your break-even ROAS (1 ÷ profit margin).
- Add a profit buffer. Many advertisers target 1.5–2× their break-even ROAS as a healthy, sustainable goal.
- Work backwards to a budget. If you know your revenue goal and your target ROAS, your required ad spend is simply Revenue goal ÷ Target ROAS. A $50,000 revenue goal at a 4x target ROAS needs $12,500 in spend.
That last step is exactly what the Ad Budget Planner tab in our ROAS calculator does — it turns a revenue goal and a target ROAS into the exact budget (and estimated order count) you need, so you stop guessing your ad spend.
Remember that target ROAS should differ by funnel stage. Cold prospecting campaigns naturally return a lower ROAS because you’re reaching new audiences, while retargeting campaigns return much higher ROAS because those people already know you. Setting a single ROAS target across both will make your prospecting look like a failure when it’s actually doing its job — feeding your retargeting.
ROAS benchmarks by channel
ROAS varies a lot by platform and intent, so treat these as directional starting points, not rules:
- Google Search Ads — often the highest ROAS, because you’re capturing existing demand (people already searching for what you sell).
- Google Shopping / Performance Max — strong for e-commerce with good product feeds.
- Meta (Facebook/Instagram) — ROAS spans a wide range; excellent for demand generation but usually lower than search on a last-click basis.
- TikTok — lower reported ROAS on last-click, higher on blended/incremental measurement; a top-of-funnel demand driver.
- Amazon Ads — measured in ACoS; convert to ROAS with 100 ÷ ACoS to compare.
The takeaway isn’t “Google is best” — it’s that you should benchmark each channel against its own role and your break-even ROAS, not against each other.
How to improve a low ROAS
If your ROAS is below break-even, don’t panic — there’s almost always a fixable leak. In order of impact, here’s where to look first:
- Targeting and audiences. Spending on the wrong people is the fastest way to kill ROAS. Tighten audiences, exclude converters where appropriate, and cut wasteful placements.
- Landing page and offer. Paid clicks that don’t convert are a landing-page problem, not an ads problem. A faster, clearer, more persuasive page lifts ROAS without touching your ad spend. (If speed is the issue, test it with our free website speed test.)
- Creative and angles. Tired creative raises your cost per click and drags everything down. Refresh hooks, formats and angles regularly.
- Bidding and budget allocation. Move money out of losing campaigns and into winners. Let profitable campaigns scale; cap or cut the rest.
- Conversion tracking. Broken or incomplete tracking makes a profitable account look unprofitable. Confirm your pixels, conversion values and UTM tracking are all firing correctly before you make big decisions.
Improving even one or two of these can move a campaign from a loss to a profit. If you’d rather have specialists find the leaks and scale what works, Devlet’s paid-ads team runs this exact audit for clients.
Common ROAS mistakes to avoid
- Ignoring margin. The number one mistake — judging ROAS without knowing your break-even point.
- Trusting platform ROAS blindly. Always sanity-check against blended ROAS.
- Optimizing for ROAS at the expense of volume. A 10x ROAS on tiny spend often means you’re leaving profitable scale on the table. Sometimes a lower ROAS at higher volume makes more total profit.
- Comparing ROAS across different funnel stages. Prospecting (cold) campaigns will always show lower ROAS than retargeting (warm) ones — don’t hold them to the same target.
- Forgetting returns and refunds. For physical products, subtract expected returns before you celebrate a ROAS.
Frequently asked questions
How is ROAS calculated?
ROAS is calculated by dividing the revenue a campaign generated by the amount you spent on it: ROAS = Revenue ÷ Ad Spend. For example, $10,000 in revenue from $2,500 in spend is a 4x ROAS.
What is a good ROAS?
A good ROAS is any figure above your break-even ROAS. For many e-commerce brands that’s around 3x–4x, but a high-margin business can profit at 2x while a thin-margin one needs 5x or more.
What does 1.5 ROAS mean?
A 1.5 ROAS means you earn $1.50 for every $1 spent on ads (150%). For most businesses that’s below break-even and means the campaign is losing money.
Is 20 a good ROAS?
Yes — a 20x ROAS is excellent. It means $20 of revenue for every $1 spent, far above break-even for any margin, and usually a sign to scale.
What ROAS is 25% ACoS?
A 25% ACoS equals a 4x ROAS, because ROAS = 100 ÷ ACoS. A 50% ACoS equals 2x ROAS, and a 10% ACoS equals 10x ROAS.
What is break-even ROAS?
Break-even ROAS is the minimum ROAS needed to cover costs, calculated as 1 ÷ your profit margin. A 40% margin gives a 2.5x break-even ROAS.
